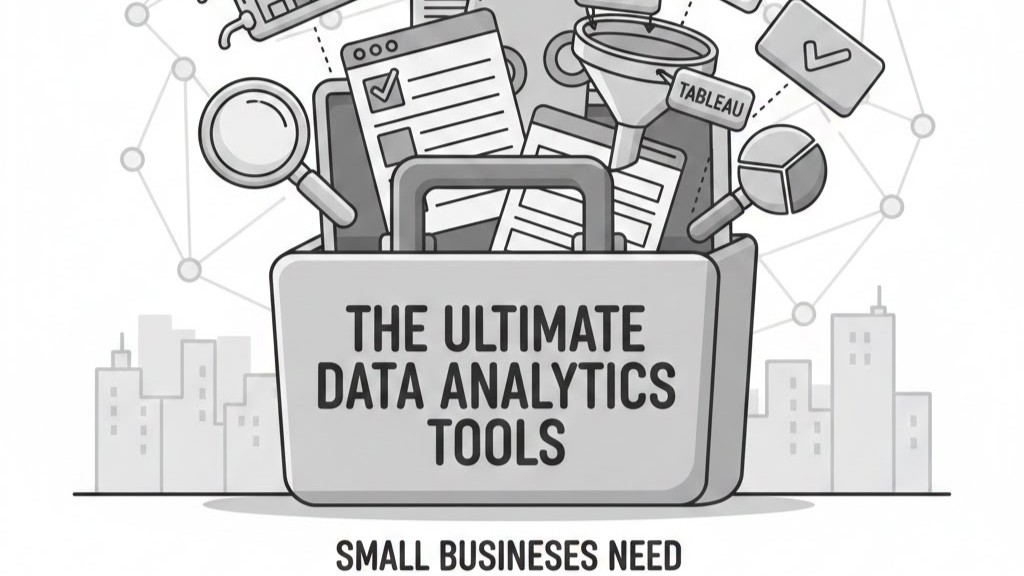
Small businesses in Malaysia are adopting data analytics faster than ever to improve decision-making, boost efficiency, and stay competitive. With the right tools, even non-technical teams can uncover insights that drive real business growth. In a rapidly evolving digital economy, leveraging Business Intelligence (BI) software allows small and medium-sized enterprises (SMEs) to transform raw transactional data into actionable strategic value. Below, we break down the top data analytics platforms designed to help small businesses succeed.
Driven by local digital economy initiatives, regulatory shifts like mandatory e-invoicing (LHDN MyInvois), and expanding e-commerce ecosystems, Malaysian SMEs face growing pressure to modernize their operational stacks. Modern BI platforms eliminate the reliance on manual spreadsheets, allowing business owners to connect sales channels, inventory databases, customer relationship platforms, and accounting records into single-pane visual dashboards. By turning daily operational metrics into predictive real-time trends, small teams can identify top-performing product lines, streamline supply chain bottlenecks, optimize marketing spend, and control cash flow with unprecedented speed and precision.
Why Data Analytics Matters for Malaysian SMEs
For small businesses, every Ringgit spent on operations, marketing, and inventory must yield measurable returns. Data analytics removes the guesswork from routine business operations, allowing founders and department heads to make decisions based on real empirical metrics.
Implementing structured data analytics platforms helps small businesses:
- Optimize cash flow management
- Understand customer purchasing habits
- Streamline inventory and supply chains
- Enhance employee productivity
Top 5 Data Analytics Tools for Small Businesses
1. Microsoft Power BI
Microsoft Power BI is a popular choice for SMEs because it’s affordable, user-friendly, and integrates smoothly with Microsoft Excel. It helps businesses visualize sales, finance, and operations data instantly through interactive, real-time dashboards.
Key Strengths
Seamless connectivity with Microsoft 365, robust natural language query tools, and flexible pricing tiers suitable for growing startups.
Ideal Use Case
Small businesses that rely heavily on Excel spreadsheets for daily tracking and want to upgrade to automated, interactive dashboard reports without a steep learning curve.
2. Google Looker Studio
Google Looker Studio is perfect for companies that rely heavily on Google Workspace and web-based marketing channels. It allows you to create customized dashboards, track marketing campaign performance, and monitor website analytics in real time.
Key Strengths
Completely free web-based platform with native integrations across Google Ads, Google Analytics 4, Search Console, and BigQuery.
Ideal Use Case
E-commerce startups, digital agencies, and marketing-driven SMEs seeking a cost-effective platform to monitor website traffic and advertising spend.
3. Tableau
Tableau is ideal for businesses that want more advanced visualizations and deeper analytical capabilities. Tableau provides richer context and actionable insights, especially for companies handling large datasets across multiple data sources.
Key Strengths
Advanced data visualization engines, sophisticated geospatial mapping, and high-performance querying on complex, multi-layered data structures.
Ideal Use Case
Scaling businesses with dedicated data analysts or tech-savvy managers looking to build highly complex, interactive reporting suites.
4. Zoho Analytics
Zoho Analytics is a great option for SMEs that need built-in reporting, process automation, and CRM integration—all at a lower operational cost.
Key Strengths
Deep native integration with the broader Zoho SaaS ecosystem, AI-powered conversational assistant (Zia), and budget-friendly tier options.
Ideal Use Case
Businesses already utilizing Zoho CRM or Zoho Books that want automated visual reports cross-referencing sales pipelines with financial ledgers.
5. Qilk Sense
Qlik Sense is known for its powerful associative data engine, advanced data modeling, and interactive dashboards. It is great for businesses that want stronger self-service analytics capabilities without rigid pre-defined data paths.
Key Strengths
Unique associative engine that highlights indirect relationships within datasets, strong augmented AI assistance, and robust mobile responsiveness.
Ideal Use Case
Data-driven organizations managing complex supply chains or multi-channel retail operations that require deep exploratory analysis.
How to Choose the Right Analytics Software for Your Team
Choosing the right data analytics software depends on your specific business goals, data volume, and team skill level. Most Malaysian SMEs start with Microsoft Power BI or Google Looker Studio due to ease of use, broad online documentation, and fast implementation cycles.
Consider the following decision framework before committing to a platform:
Assess Your Data Ecosystem
If your daily operations run predominantly on Microsoft Excel, SharePoint, and Teams, Power BI offers the smoothest transition. If your business depends on digital marketing channels, web traffic, and Google Sheets, Google Looker Studio is the logical starting point.
Evaluate Internal Technical Readiness
Avoid buying complex enterprise tools if your internal team lacks data modeling experience. Choose tools that support drag-and-drop report building and pre-built dashboard templates.
Factor in Total Cost of Ownership
Look beyond initial monthly software license fees. Account for potential connector costs, training requirements, data storage fees, and ongoing administrative maintenance.
Prioritize Data Governance and Security
Ensure your chosen platform provides robust role-based access permissions, secure cloud hosting, and compliance with data protection laws like Malaysia’s Personal Data Protection Act (PDPA).
Step-by-Step Data Implementation Roadmap for SMEs
Rolling out a new business intelligence platform requires a structured approach to prevent project delays and ensure high user adoption across your team:
1. Audit and Goal Setting
- Identify the key performance indicators (KPIs) that matter most to your business (e.g., customer acquisition cost, monthly recurring revenue, inventory turnover rates).
- Locate where your operational data lives (e.g., accounting software, POS systems, CRM databases, localized spreadsheets).
- Standardize data entries to eliminate formatting inconsistencies, duplicate records, and missing values.
2. Pilot Dashboard Creation
- Select a single core business unit (e.g., sales or finance) to run an initial pilot program.
- Connect your data analytics software to the primary data source and build a clean, automated visual dashboard.
- Validate calculated metrics against manual ledgers to ensure absolute financial and operational accuracy.
3. Team Enablement and Training
- Conduct practical hands-on training sessions to teach team members how to filter dashboards, interpret visual trends, and export reports.
- Establish clear workflows for how data insights will be used during weekly management and department meetings.
- Leverage structured training support, such as HRDC-claimable corporate upskilling programs in Malaysia, to minimize training costs while upskilling staff.
Common Data Analytics Mistakes Small Businesses Should Avoid
Even with the best software tools, small businesses can run into common pitfalls during digital adoption:
- Collecting Data Without Clear Objectives
- Ignoring Data Quality
- Over-Complicating Visual Dashboards
- Failing to Up-skill Staff
Conclusion
Data analytics is no longer an exclusive luxury reserved for massive multinational corporations. By combining accessible, user-friendly software platforms with proper cultural adaptation and hands-on workforce upskilling, Malaysian small businesses can unlock significant competitive advantages.
Whether you choose Power BI for deep Microsoft integration, Looker Studio for marketing performance, or Tableau for complex visualization, taking control of your operational data is the single most impactful step toward building an agile, profitable, and future-ready enterprise.
FAQs
1. What is the easiest data analytics tool for a non-technical small business team?
Google Looker Studio and Microsoft Power BI are widely considered the most accessible platforms for non-technical teams. Looker Studio offers a straightforward drag-and-drop web interface, while Power BI builds upon familiar Microsoft Excel formulas and layout.
2. Can Malaysian small businesses claim training expenses for data analytics courses?
Yes. Malaysian companies registered under HRD Corp can claim corporate training costs for certified data analytics, Microsoft Power BI, and digital transformation courses through the HRDC SBL-Khas scheme.
3. Is Microsoft Power BI completely free to use?
Microsoft Power BI offers a free desktop application (Power BI Desktop) that allows users to create reports locally. However, sharing interactive dashboards and collaborating securely across a team requires a Power BI Pro or Premium cloud license.
4. How long does it take for a small business to implement data analytics tools?
Basic dashboard implementations using tools like Power BI or Looker Studio can take anywhere from a few days to two weeks, depending on data cleanliness and source accessibility.
5. What is the difference between reporting and data analytics?
Reporting organizes raw data into static summaries to show what happened in the past (e.g., quarterly sales figures). Data analytics uses visual modeling and data exploration to explain why it happened and what is likely to happen in the future.